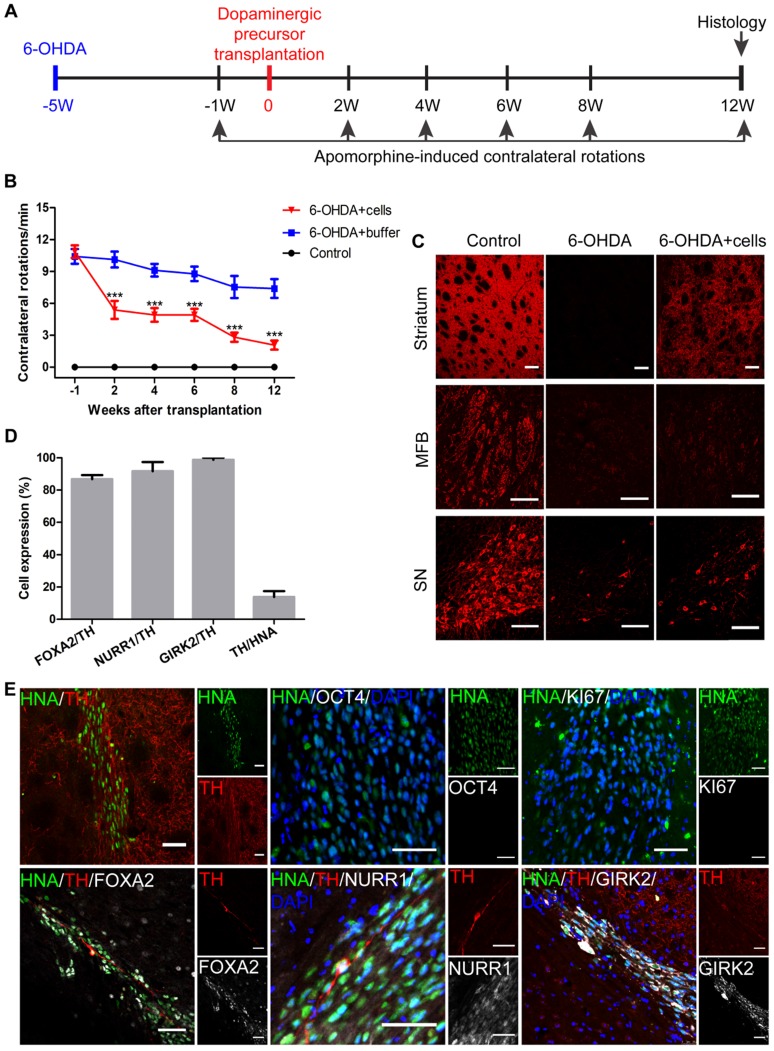
Figure 7.
Transplantation of iNSC-derived mDA precursors into PD mouse models. (A) A schematic representation of the cell transplantation and behavioral test procedure. (B) The results of apomorphine-induced contralateral rotations at different time points from the 6-OHDA+buffer group (n=8), 6-OHDA+cells group (n=10), and control group (n=3). ***p < 0.001 by two-way ANOVA with Dunnett's multiple comparison test. (C) TH immunofluorescent staining for TH on an unlesioned control, 6-OHDA-leisoned hemisphere and the hemisphere with 6-OHDA+cells, at levels of striatum, MFB, and SN. Scale bars, 100 μm. MFB: medial forebrain bundle; SN: substantia nigra. (D) The percentages of FOXA2/TH, NURR1/TH, GIRK2/TH, TH/HNA in PD mice 12 weeks after transplantation (n=10). HNA: human nuclei antibody. (E) Immunofluorescent staining for TH, KI67, OCT4, FOXA2, NURR1 and GIRK2 in PD mice 12 weeks after transplantation. Scale bars, 50 μm. Also see Figures S7 and S8.

