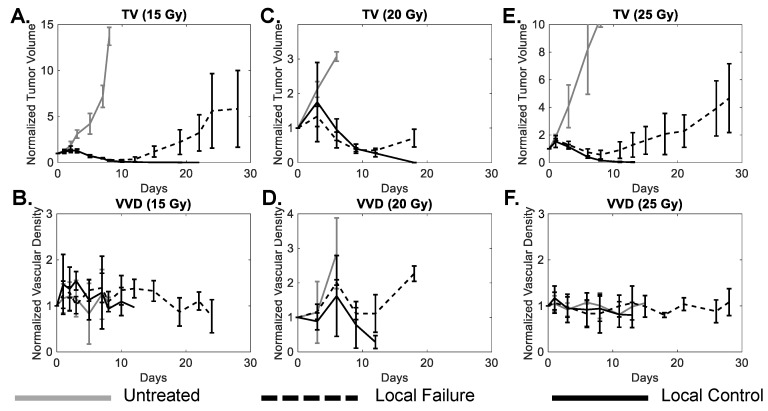
Figure 4.
A comparison of tumor volume (A, C, E) and tumor microvascular density (B, D, F) growth curves for local control (solid black), local failure (dotted black), and untreated tumors (solid gray) for each dose group. Sample sizes for local control, local failure, and untreated groups were 3, 4, and 2 for the 15 Gy group, 2, 3, and 5 for the 20 Gy group, and 5, 3, and 2 for the 25 Gy cohorts, respectively. Error bars represent standard deviation.

