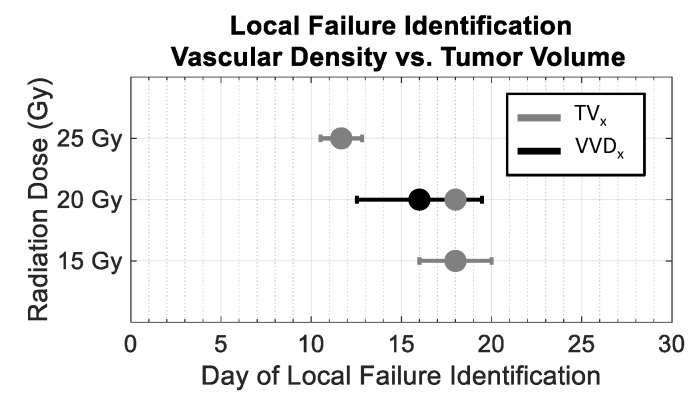
Figure 7.
Dose dependence of the early detection of treatment failure by tumor vascular density. Local failure identification using vascular density (black) occurred earlier than using tumor volume (gray). VVDx could only be determined for the 20 Gy group and not in the 15 or 25 Gy cohorts due to noise in the longitudinal growth curve data.

