Figure 7.
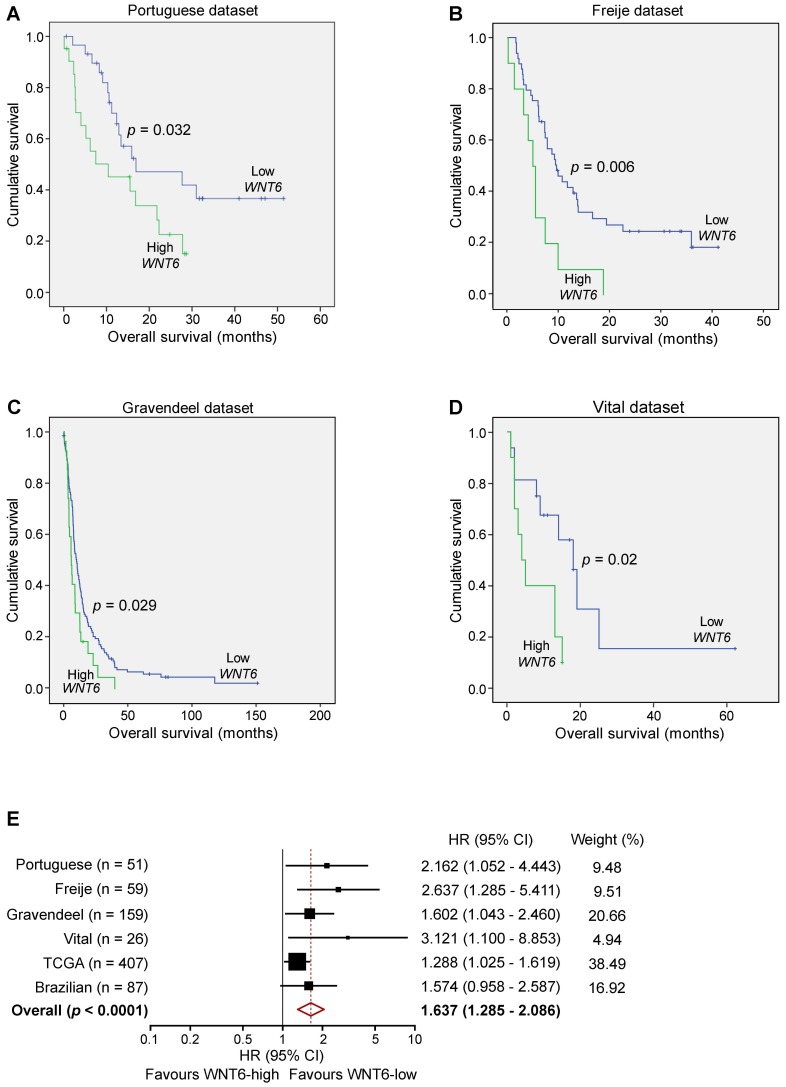
WNT6 expression is prognostically valuable in GBM patients. Kaplan-Meier survival curves of WNT6-low and WNT6-high GBM patients derived from qRT-PCR data (A) or microarray (B-E) data. (A) Portuguese dataset, n = 51, median OS 16.9 vs. 10.4 months (low vs. high WNT6 expression, respectively; p = 0.032, Log-rank test). (B) Freije dataset, n = 59, median OS 9.6 vs. 5 months (p = 0.006, Log-rank test). (C) Gravendeel dataset, n = 159, median OS 10.1 vs. 6 months (p = 0.029, Log-rank test). (D) Vital dataset, n = 26, median OS 18 vs. 4 months (p = 0.02, Log-rank test). (E) Forest plot of hazard ratios (HR), illustrating the associations between WNT6 expression and overall survival in GBM patients. Each cohort is accompanied by its HR (black square; the size of the square represents the weight of the study in the meta-analysis) and 95% confidence intervals (extending lines). The diamond represents the estimated pooled effect (HR = 1.637; 95% confidence interval: 1.285 - 2.086; p < 0.0001). CI: confidence interval; HR: hazard ratio.

