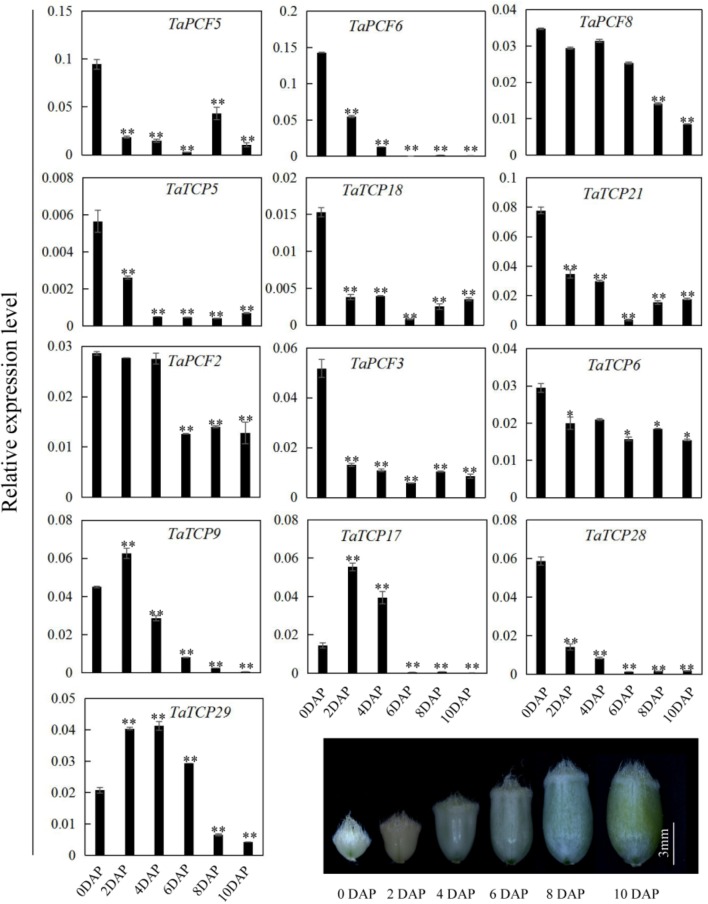
FIGURE 10.
TaTCP gene expression patterns during grain development. Expression levels were detected by qRT-PCR with immature grains at six stages: 0, 2, 4, 6, 8, and 10 days after pollination (DAP). Three biological duplicates were performed; Y axis represents the relative expression value to GAPDH gene, the internal control. Asterisks indicate significant difference relative to W2, as determined by Student’s t-test (∗p < 0.05, ∗∗p < 0.01).

