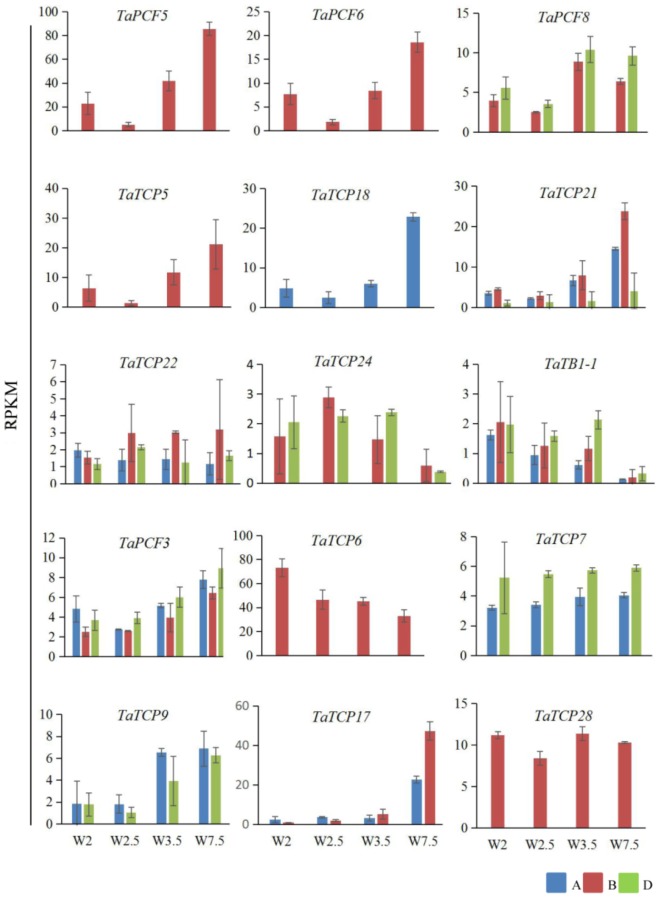
FIGURE 7.
Expression patterns wheat TCP genes during young spike development by RNA-seq. Developmental stages are indicated using Waddington (W) scales (Waddington et al., 1983). W2, double ridge (DR); W2.5, floral meristem stage (FM), W3.5, anther meristem stage (AM); and W7.5, tetrad stage (TS). Y axis is the RPKM (Reads per kilobase per million mapped reads) value; gene names are shown in Supplementary Table S2. Each point of the RPKM represents the average of two biological replicates. Error bars indicate SD.

