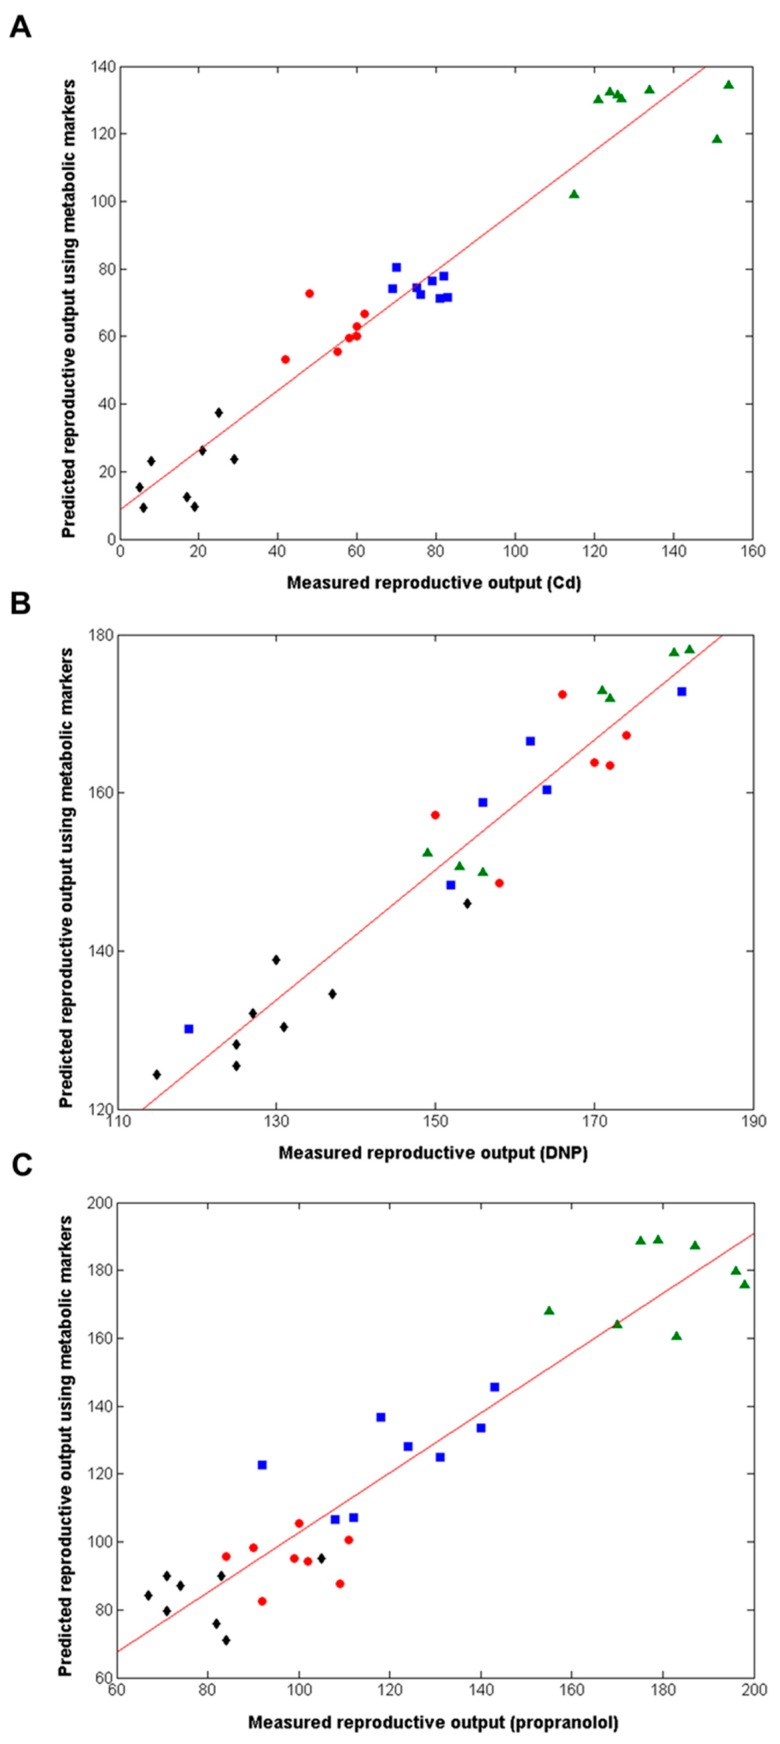
Figure 3.
Correlation between measured and predicted reproductive output for individual D. magna, the latter derived from forward-selected PLS-R models built using the metabolomics datasets, following chronic exposure to (A) Cd, (B) DNP and (C) propranolol, including lines of best fit. The cross-validated R2 values are 0.935 for Cd (561 peaks, 2 LVs), 0.945 for DNP (306 peaks, 3LVs) and 0.893 for propranolol (606 peaks, 3LVs); p = < 0.001 in all cases. Classes comprise of control (▲), Low dose (■), medium dose (●) and high dose(s) (◆).

