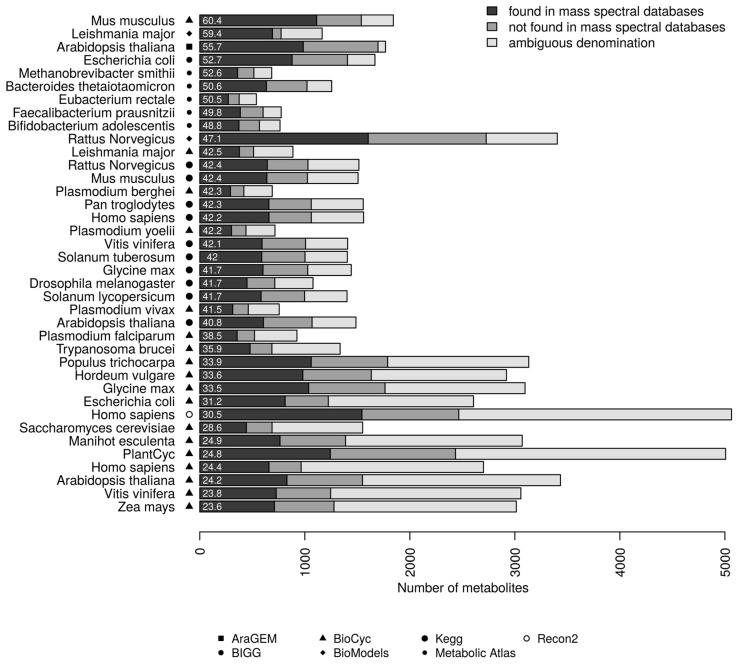
Figure 2.
Coverage of prokaryotic and eukaryotic metabolic networks by mass spectral libraries. The genome-scale metabolic models are listed according to an increasing percentage of metabolites covered by mass spectral libraries. The percentage from 60.4 down to 23.6 is displayed to the left of each bar. “Found in mass spectral databases” refers to metabolites that can be mapped in at least one mass spectral database. “Not found in mass spectral databases” refers to compounds with an InChI from metabolic models that could not be matched with any compound in any mass spectral databases. “Ambiguous denomination” refers to compounds with undefined structures or insufficient information to retrieve the unambiguous InChIKey identifier; these compounds were not mapped.

