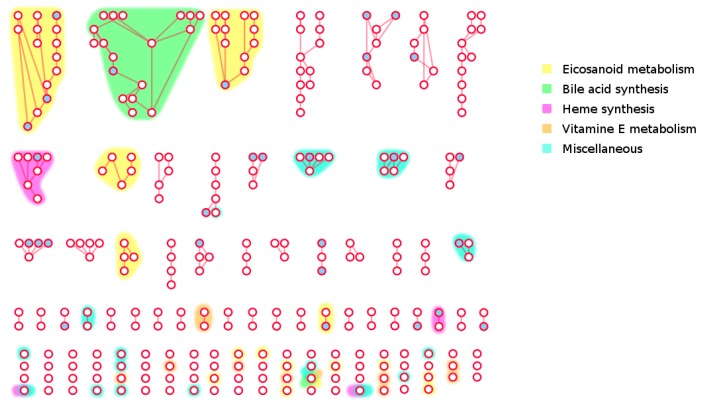
Figure 6.
The ‘dark side’ of Human metabolism. The least covered subgraph of Recon 2.03 obtained from LPA using mapping status as the initial state. White circles: Non-mapped metabolites. Blue circles: mapped metabolites. Edges: Substrate-product relationships. Metabolites with ambiguous identifier have been removed. Colored Hulls: Pathways overrepresented in the poorly mapped area of the human metabolic network Recon 2.03. Right-tailed Fisher exact test with Benjamini-Hochberg correction, α = 0.05.

