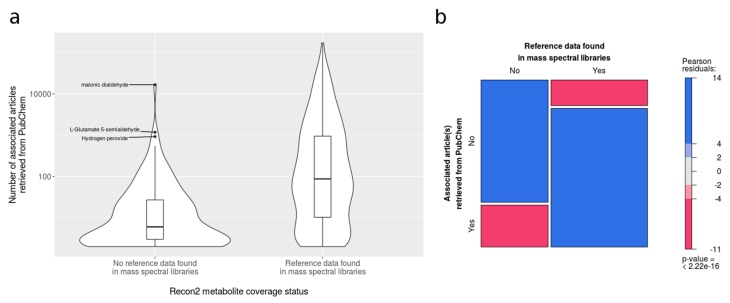
Figure 8.
Relationship between the coverage status of Recon2 metabolites and the scientific literature. (a) Violin plots showing the distribution of the number of articles associated with mapped and non-mapped metabolites in Recon2. Y axis shows the number of articles (logarithmic scale) obtained from PubMed references in PubChem entries. Only metabolites with at least one associated article are considered. (b) Mosaic plot showing the proportion of Recon2 metabolites with PubMed references. Only metabolites with PubChem CID annotation were considered. The area of the tiles is proportional to the number of metabolites within each category. The color and shade of the tiles correspond to the sign and magnitude of the Pearson residuals. The Pearson residuals represent the contribution of the tile to the chi-squared statistics, assessing whether the two variables are independent or not. Red tiles indicate the proportion of under-represented metabolites, namely, metabolites with a smaller number of PubMed references than expected if the two variables (i.e., an entry in spectral libraries and a PubMed article in PubChem) were independent, while blue tiles indicate over-represented metabolites, namely, metabolites with a greater number of PubMed references than expected.

