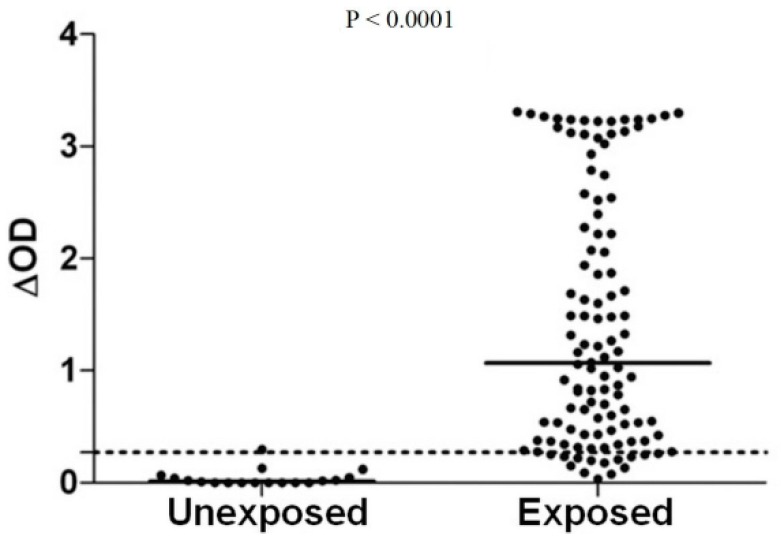
Figure 3.
IgG Ab response to Ae. albopictus salivary gland extracts (SGEs) between exposed and unexposed individuals to Ae. albopictus bites in La Reunion Island [23]. Black points indicate individual IgG response (ΔOD) and bars represent the median value in each group. Dotted line represents the cut-off of specific Ab response (ΔOD > 0.181) and p value was calculated using the Mann–Whitney U test.

