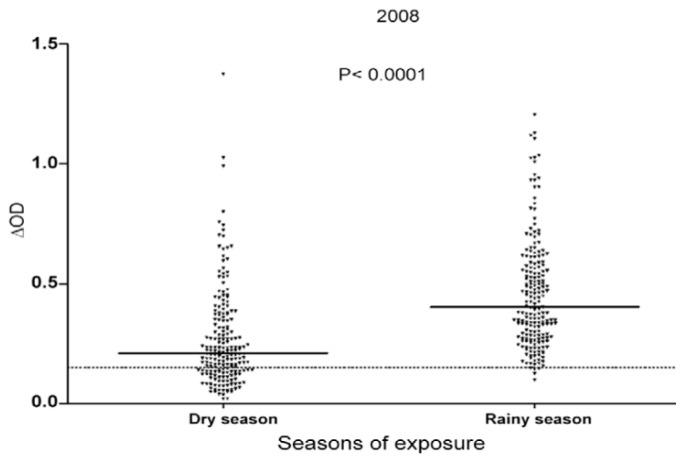
Figure 6.
Evolution of individual IgG response to Nterm-34 kDa peptide between the dry and the rainy season [27]. Results are presented for the peak of the dry (February) and the rainy (July) season in 2008. Black points indicate individual IgG response (ΔOD) and bars indicate the median value for each group. Dotted line represents the threshold (TR) of specific Ab response (ΔOD = 0.151) and the statistical significant difference between medians is indicated (non-parametric Wilcoxon test).

