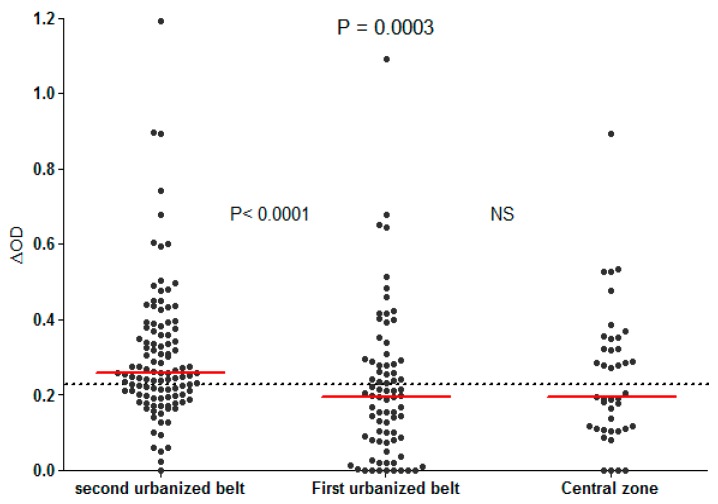
Figure 7.
IgG Ab response to Nterm-34 kDa salivary peptide in the studied population according the level of urbanisation of their residential areas in Vientiane city [28]. Black dots indicate individual IgG response (ΔOD), and bars represent the median value in each group. Dotted line represents the cut-off of a specific Ab response (ΔOD > 0.250). Statistically significant differences between the three groups (P = 0.0003, nonparametric Kruskal–Wallis test) and between the first and second urbanised belts (P < 0.0001, Mann–Whitney U test) are indicated.

