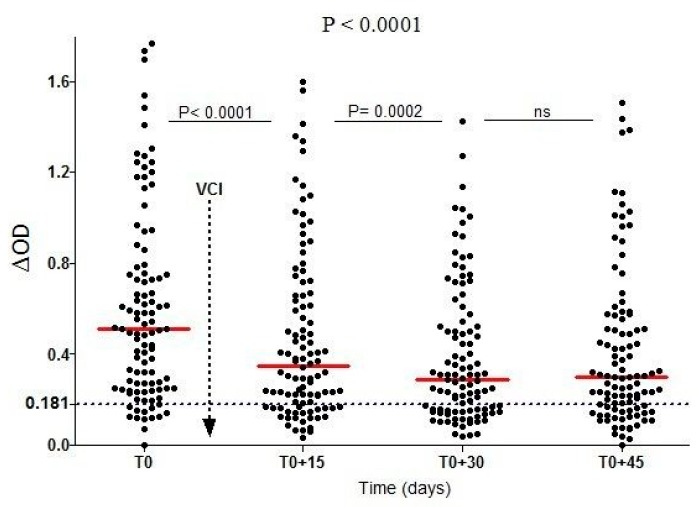
Figure 8.
IgG Ab response to Nterm-34 kDa salivary peptide from individuals exposed to Ae. albopictus bites before and after vector control implementation [29]. Individual IgG Ab response (ΔOD) is presented just before (T0) and then 15, 30, and 45 days after vector control implementation. Bars indicated the median value in the population at each time point and the dotted line represents the cut-off of immune response. P-values indicating differences in IgG response level at the overall time points (Kruskal–Wallis test) or between two different time points (Wilcoxon matched pair test) are presented. Vertical solid grey line indicates timing of Vector Control Implementation (VCI).

