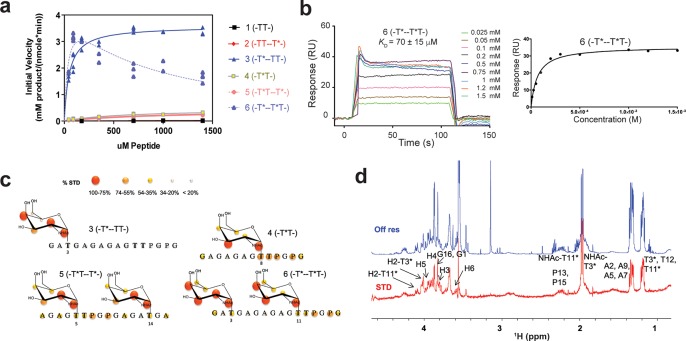
Figure 1.
Biophysical characterization of GalNAc-T4. (a) Peptide glycosylation kinetics of GalNAc-T4 against (glyco)peptides 1–6 (see also Figure 4a). Michaelis–Menten kinetic values, Km, Vmax, and catalytic efficiency (Vmax/Km) for glycopeptides 3–6 were obtained from the nonlinear least-squares fit to the initial rate data, obtained as described in the Methods section and given in Table 2. Peptide substrates 1 and 2 are largely unglycosylated by GalNAc-T4.14 (b) Left panel: SPR sensogram for binding of glycopeptide 6 to GalNAc-T4. Right panel: Fitting of the SPR binding data giving a Kd of 70 ± 15 μM. (c) Mapping of substrate binding epitopes by saturation transfer difference (STD) NMR. The size of the colored spheres represents the normalized STD-NMR intensity (i.e., binding) observed for the indicated protons/residues. For sake of clarity, the STD response given for the indicated amino acid residues corresponds to the average of STD for all of the protons in the residue that could be accuracy measured. See Figures S4–S6 for the detailed STD-NMR enhancements of the identified residues/protons. Note that in addition to the GalNAc protons amino acid protons in the -T*TPGP- sequence also gave STD-NMR enhancements. (d) Representative 600 MHz 1H NMR spectra of glycopeptide 6 (-T*--T*T-) at 877 μM in the presence of 13.5 μM GalNAc-T4, 75 μM UDP, and 75 μM MnCl2 obtained at 298 K. The off resonance reference spectrum (labeled Off res) is displayed in blue, and the on resonance STD spectrum (labeled STD) is in red. Key proton resonances are labeled in the STD spectrum. Note the different STD responses for the identified GalNAc H2 protons of the glycosylated Thr3 and Thr11 found between 4.0 and 4.1 ppm of the STD spectrum.

