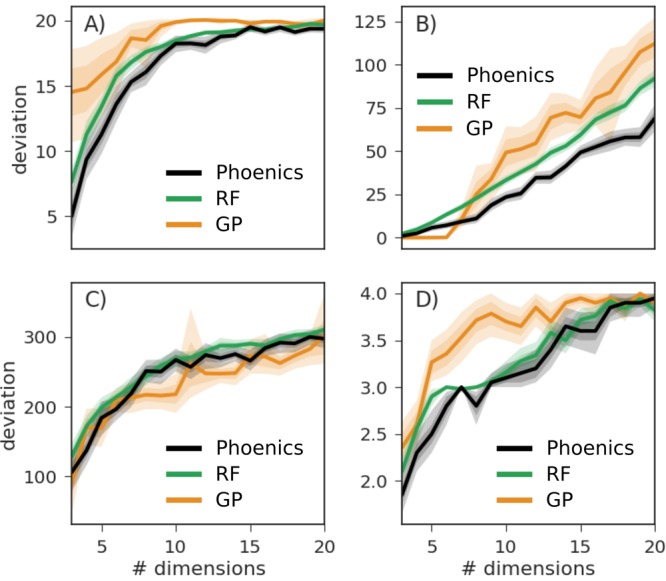
Figure 5.

Average deviations taken over 20 independent runs between the lowest encountered objective function value and the global minimum achieved after 200 objective function evaluations for different parameter set dimensions. Results are reported for Ackley (A), Dejong (B), Schwefel (C), and dAckley (D). Uncertainty bands illustrate bootstrapped estimates of the deviation of the means with one and two standard deviations.
