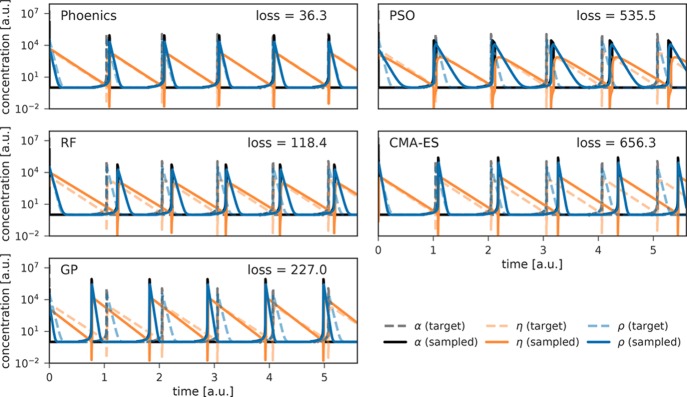
Figure 7.
Time traces of dimensionless concentrations of compounds in the Oregonator model. Target traces are depicted with solid, transparent lines while predicted traces are shown in dashed, opaque lines. Traces were simulated for a total of 12 dimensionless time units, but are only shown for the first six time units for clarity.

