
Figure 1.
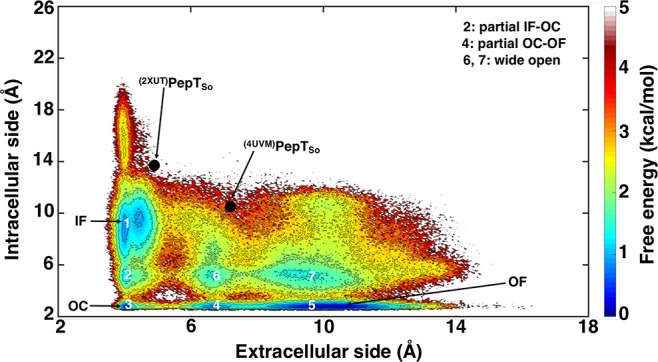
Conformational landscape of PepTSo. The conformational landscape is generated using the extracellular and intracellular side distances measured between atom pairs Arg32-CZ (TM1)–Asp316-CG (TM7) and Ser131-CO (TM4)–Tyr431-OH (TM10), respectively. The conformational states are depicted as IF (1), partial IF–OC (2), OC (3), partial OC–OF (4), OF (5), and wide open states (6 and 7). The black dots indicate the PepTSo crystal structures available in the Protein Data Bank.