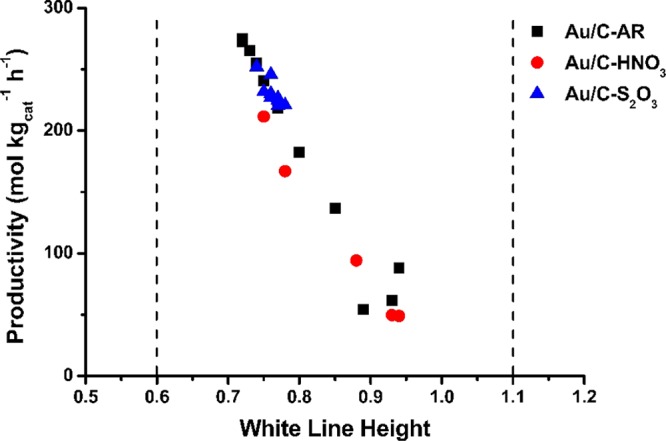
Figure 7.

Correlation between VCM productivity and change in normalized white-line intensity of the 1 wt % Au/C–AR, 1 wt % Au/C–HNO3, and 1 wt % Au/C–S2O3 catalysts. Dashed lines represent the white-line intensities of the Au+ [AuCl2]− standard (value of 0.6) and the Au3+ KAuCl4 standard (value of 1.1). [AuCl2]− standard from difference spectra calculated in ref (24) (reproduced from ref (22)).
