Figure 2.
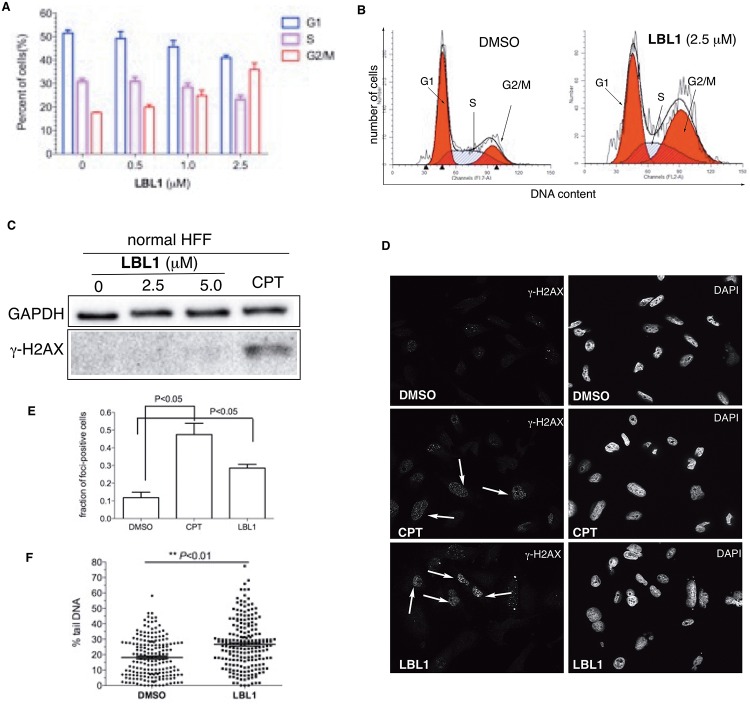
LBL1 induced DSBs in cancer cells. (A) LBL1 arrested the cells at G2/M phase. The cell cycle distribution of MDA-MB-231 cells treated with different concentrations of LBL1 for 48 h. Then the cell cycle profile was analyzed by flow cytometry after the cells were fixed and stained with PI. (B) LBL1 induced G2/M arrest and G1 peak broadening in MDA-MB-231 cells. The cells were treated with LBL1 for 48 h. The different cell cycle stages (G1, S, G2/M) are indicated. (C) LBL1 did not induce phosphorylation of H2AX in normal primary HFF. The cells were treated with indicated drugs for 24 h. Then the cells were collected, and the lysates were prepared for Western blot analysis with indicated antibodies. CPT was used as a positive control. (D, E) Quantification of γ-H2AX-foci-positive MDA-MB-231 cells. Data are presented as mean ± SD (n = 3, ∼100 cells were analyzed for each experimental condition). Representative fluorescence micrographs are shown in part D, and quantification is shown in part E. (F) Quantification of tail DNA from the neutral COMET assay in MDA-MB-231 cells treated with LBL1. Around 200 cells were analyzed for each condition (n = 193 for DMSO and n = 203 for LBL1-treated cells). The representative micrographs are shown in Figure S3B.

