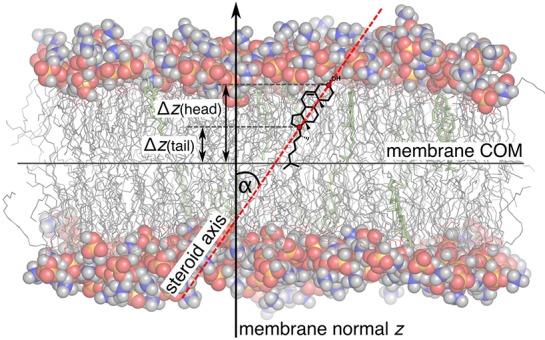
Figure 2.

Typical simulation system. Lipid head groups are shown in sphere representation, lipid tails as gray sticks, and steroids as green sticks. Water is omitted for clarity. The steroid axis (red dashed line), membrane normal (black arrow), steroid tilt angle α, and vertical positions of the steroid head and tail atoms relative to the membrane center of mass (COM) are indicated.
