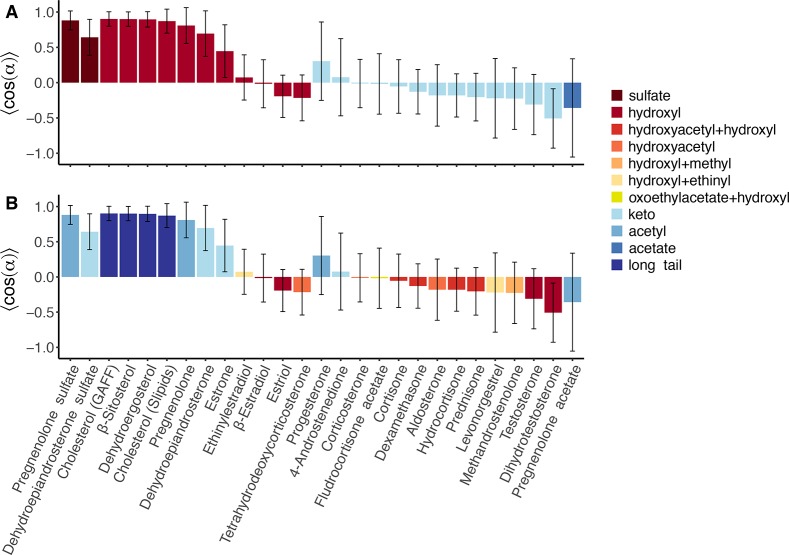
Figure 3.
Tilting of the steroids with respect to the membrane normal, quantified by the mean of the cosine of the tilting angle between the steroid axis and the membrane normal (mean and SD over 500 ns and 14 steroid molecules). The bar plots are colored according to the functional group on (A) the C-3 (“head”) atom and on (B) the C-17 (“tail”) atom (see legend and Figure 1). Values of cos(α) of 1, 0, and −1 indicate a vertical orientation (as in cholesterol), a horizontal orientation, and an inverted vertical orientation, respectively. For cholesterol, results from two different force fields are shown (GAFF and Slipids, see the Methods section in the SI).

