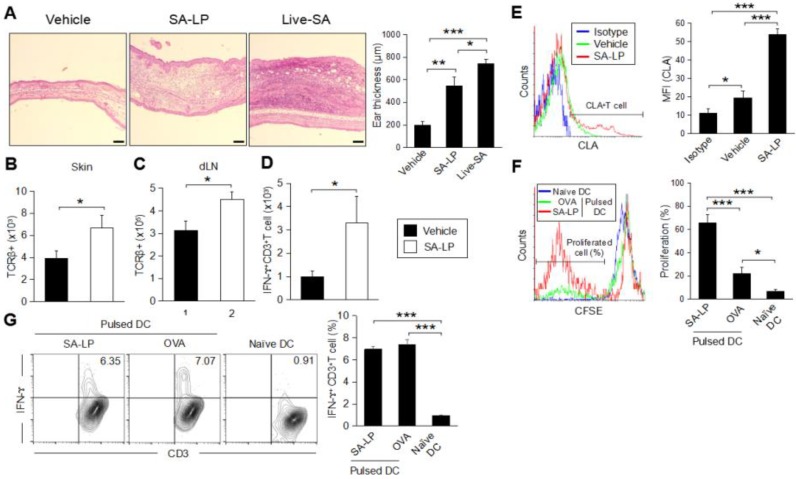
Figure 3.
SA-LP induces skin inflammation, accompanied with antigen-specific effector T cell accumulation. (A–E) WT mice were treated with SA-LP (and live-SA) or vehicle solution (0.9% NaCl) by ID injection into the ear. After 120 hr of the treatment, the mice were used for each analysis. (A) Skin histology of the treated ear. Ear section was stained with H–E. The scale bar represents 100 μm. Thickness of the treated ear was measured from each section. (B,C) Total number of T cells on the treated skin (B) and skin-dLN (C). The TCRβ+ T cells were detected from skin-isolated leukocytes by flow cytometry. (D) Total number of IFN-ɤ-producing T cells on the SA-LP-treated ear. The isolated skin leukocytes were re-stimulated with PMA (100 ng/mL) and ionomycin (1 μg/mL). The cells were treated by intracellular staining for IFN-ɤ detection. The IFN-γ+CD3+T cells were detected from stained cells by flow cytometry. (E) CLA expression on the skin T cell in SA-LP mice. The isolated skin leukocytes were analyzed by flow cytometry. The CLA+ cells were detected from the population gated on CD3+T cells. The MFI of CLA was calculated from the histogram. (F) Ex vivo antigen re-stimulation for skin T cells. The skin leukocytes were isolated from SA-LP ID-injected ear, then the cells were labeled by CFSE. For re-stimulation, the cells were cocultured with antigen (SA-LP or LPS + OVA) activated or naive splenic DCs for 24 hr. The proliferated cells were detected from the population gated on CD3+ cells by flow cytometry. The T cell proliferation rate (%) was calculated from the histogram. (G) In vitro antigen presentation for naive T cells. Splenic DCs were stimulated with antigen (SA-LP or OVA + LPS) for 24 hr. The stimulated or naive DCs were cocultured with splenic naive T cells for 72 h. At the last 6 hr, the cells were re-stimulated with PMA (100 ng/mL) and ionomycin (1 μg/mL). The proliferated T cells were treated with intracellular staining for IFN-ɤ+CD3+T cell detection by flow cytometry. The percentage of IFN-ɤ-producing T cells was calculated from the flow cytometry image. (B–F) In each experiment, 3–5 mice were used for vehicle and SA-LP ID injection. The isolated cells from the ear and dLN were pooled, and used for flow cytometry analysis. Data are shown as the mean and SD of at least three samples of a single experiment, and are representative of at least three independent experiments. A Student’s t-test was used to analyze data for significant differences. Values of * p < 0.05, ** p < 0.01, and *** p < 0.001 were regarded as significant.

