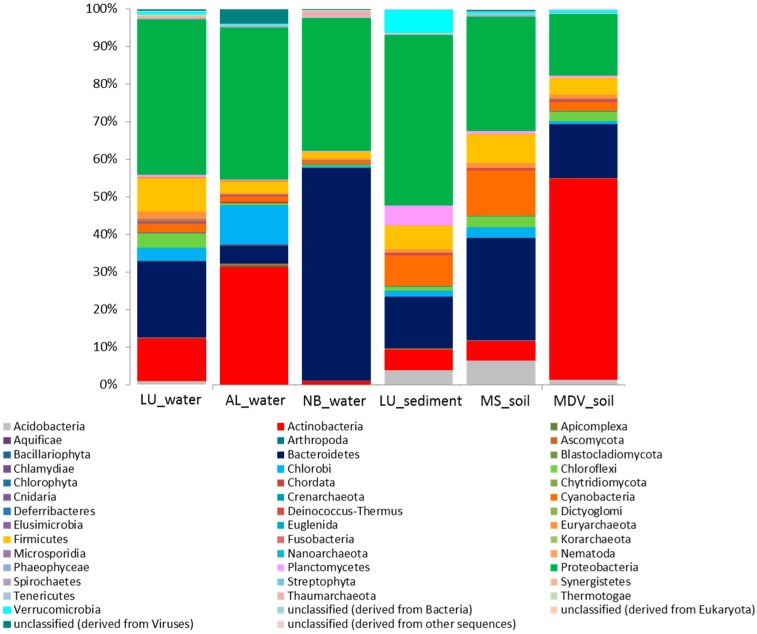
Figure 2.
Stacked column bar graph representing the microbial community composition at the phylum level across all samples used in this study. Taxonomic identities that could not be shown to the respective level of resolution were considered as “unclassified” within their corresponding domain. Relative abundance data was analyzed by using MG-RAST against the SEED database and then visualized using Microsoft Excel Software (Microsoft, Seattle, WA, USA). Sample names are included in the plot (LU_water = Lake Untersee water; AL_water = Ace Lake water; NB_water = Newcomb Bay Lake water; LU_sediment = Lake Untersee sediment; MS_soil = Mount Seuss soil; MDV_soil = McMurdo Dry Valleys soil).

