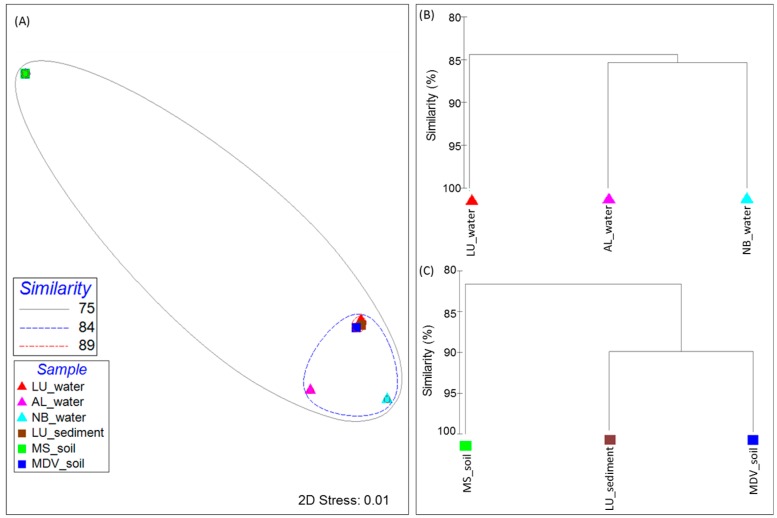
Figure 4.
Beta diversity visualization of the filtered cold-induced and cold-associated general stress-responsive proteins across all samples used in this study. (A) Multidimensional-scaling (MDS) plot analysis representing the cluster pattern in a two-dimensional (2D) rendering with similarity overlays. Samples are denoted as triangles and rectangles for the sample group type (corresponding to the water group and the soil and lake sediment group, respectively) in the plot, and are colored by the sample. The dendrogram displays the cluster patterns of (B) the water and (C) soil and lake sediment group samples according to the Bray–Curtis value as a percentage (0 to 100). Both plots were generated through PRIMER-6 Ecological Software based on the Bray–Curtis similarity metric. Sample names are included in the plot (LU_water = Lake Untersee water; AL_water = Ace Lake water; NB_water = Newcomb Bay Lake water; LU_sediment = Lake Untersee sediment; MS_soil = Mount Seuss soil; MDV_soil = McMurdo Dry Valleys soil).

