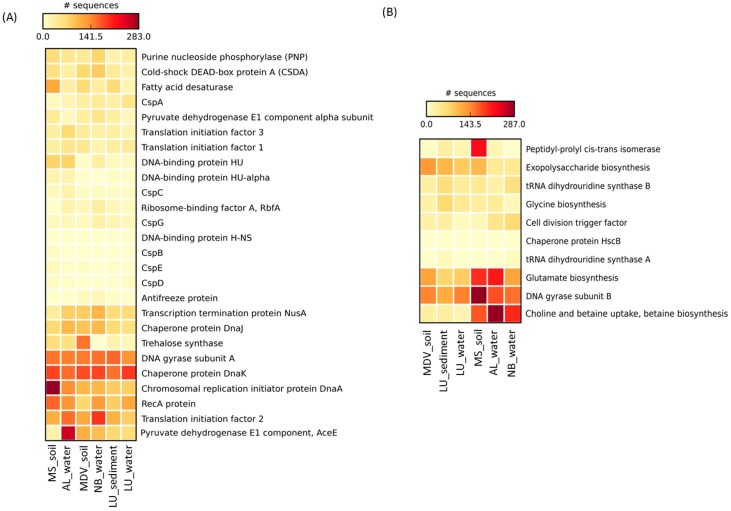
Figure 5.
Heatmap representing the relative abundance of the (A) cold-induced proteins and (B) cold-associated general stress-responsive proteins found in this study against the SEED database. The heatmap was generated through STAMP [51] with the average neighbor (UPGMA) method using the default parameters. Larger values are represented in red and the smaller values in light yellow. Sample names are included in the plot (LU_water = Lake Untersee water; AL_water = Ace Lake water; NB_water = Newcomb Bay Lake water; LU_Sediment = Lake Untersee sediment; MS_soil = Mount Seuss soil; MDV_soil = McMurdo Dry Valleys soil).

