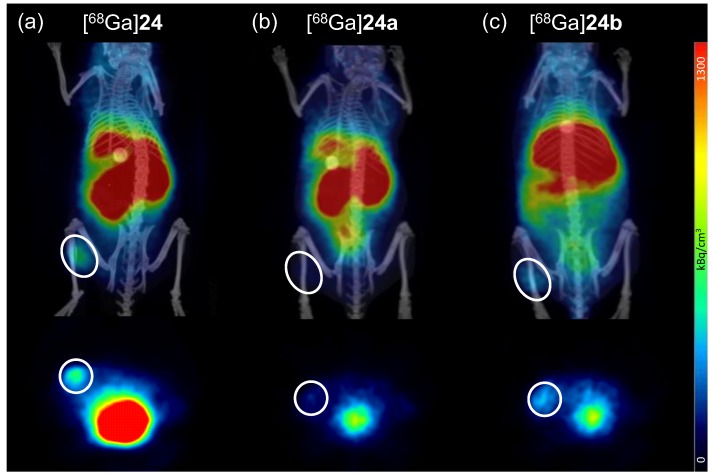
Figure 8.
Representative small animal positron emission tomography/computed tomography (PET/CT) imaging results for [68Ga]24 (a); [68Ga]24a (b) and [68Ga]24b (c). The images show coronal (upper row) and transaxial (lower row) slices for all tracers at 37.5 min p.i. The same scaling was used for all images and 4 animals were examined per radioligand. The tumor is encircled in each image.

