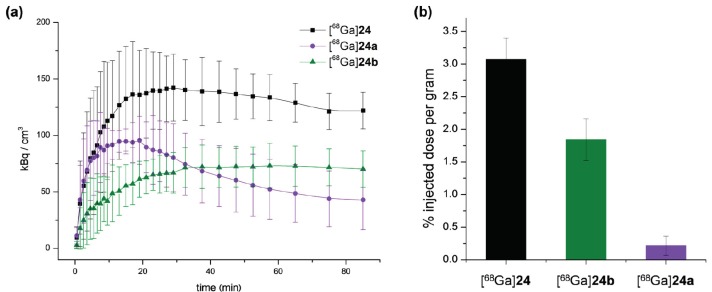
Figure 9.
Absolute tumor uptakes as determined by in vivo PET imaging as well as ex vivo biodistribution experiments (n = 4). (a) Time-activity-curves are depicted, showing tumor uptakes over the course of PET imaging for [68Ga]24 (black), [68Ga]24a (purple) and [68Ga]24b (green); (b) Tumor uptakes (% injected dose per gram) are shown for [68Ga]24 (black), [68Ga]24a (purple) and [68Ga]24b (green) as determined by ex vivo biodistribution directly after the completed diagnostic scans.

