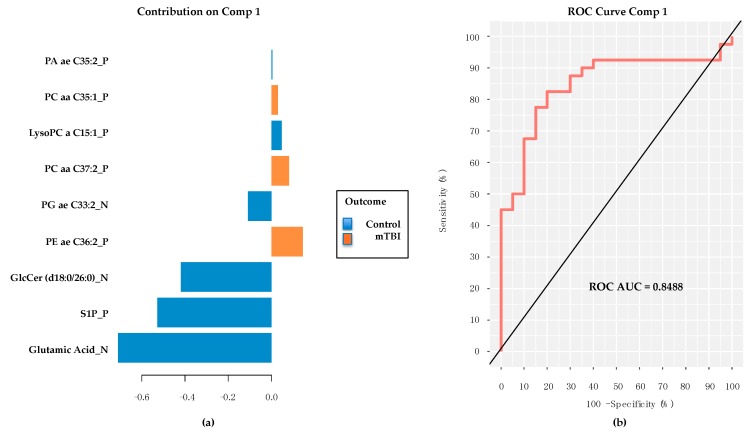
Figure 4.
Contribution plot and performance of 9 common subacute TBI biomarkers classifying the PD/PPD subjects from PD controls. (a) Note prominence of the Glutamic Acid contribution, but with relative abundance values reduced in PD/PDD and compared to controls. (b) Respectable performance (ROC AUC = 0.8488) of 9 member panel in classifying PD/PDD subjects from controls. Comp = PLS-DA model component. TBI = traumatic brain injury. PD = Parkinson’s disease. PDD = PD dementia. ROC AUC = receiver operating characteristic area under the curve. PA = Phosphatidic acid. PC = phosphatidylcholine. LysoPC lysophosphatidylcholine. PG = Phosphatidylglycerol. PE = phosphatidylethanolamine. GlcCer = glucosylceramide. S1P = sphingosine-1-phosphate. Final metabolite identifications will require additional tandem mass spectrometry (MS/MS) analyses. Metabolites confirmed via MS/MS are considered fully validated, to a high degree of confidence.

