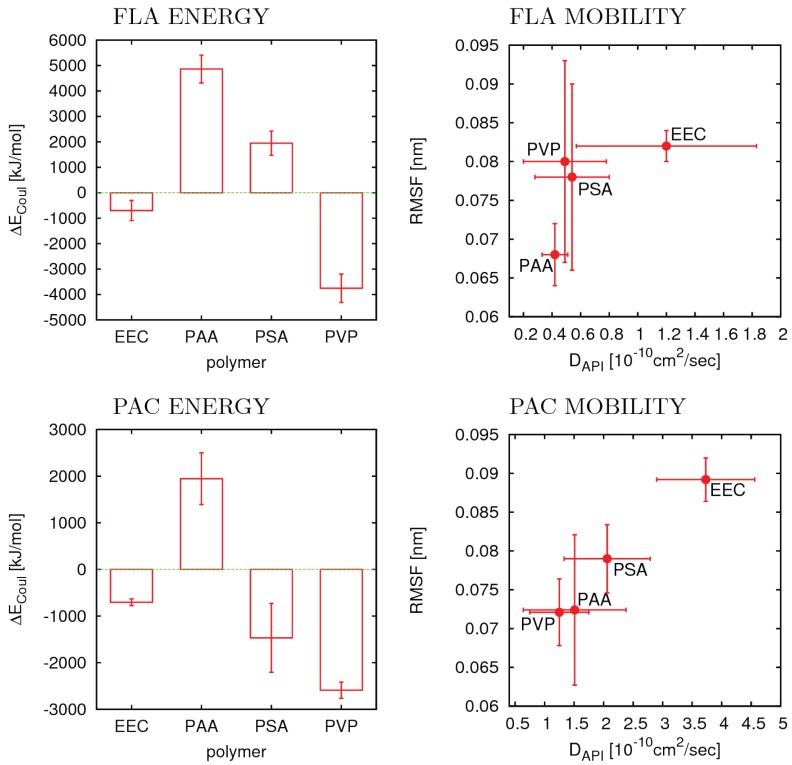
Figure 5.
Results from MD simulations of API (40 wt %) blends in four different polymer matrices: FLA (top); and PAC (bottom). The two diagrams on the left show the changes of the Coulomb interaction energies upon mixing. The diagrams on the right show API translational diffusion coefficient and roto-vibrational mobility (RMSF). Each point is labeled with the corresponding polymer type. The error bars are standard deviations calculated from four replicates.

