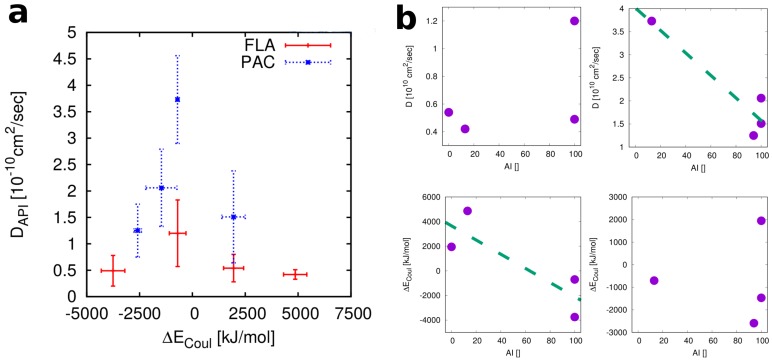
Figure 6.
(a) Comparison of the ranges of E and diffusion coefficients for FLA vs. PAC. The polymers are in the order of increasing E: PVP, EEC, PSA, PAA (for FLA), and PVP, PSA, EEC, PAA (for PAC). (b) Correlations between calculated descriptors (top: API Diffusion coefficient, bottom: Coulomb contribution to the mixing energy) and amorphous stabilities (AI values for 40% drug-load) for FLA (left column) and PAC (right column). The dashed green lines are included as guide for the eye.

