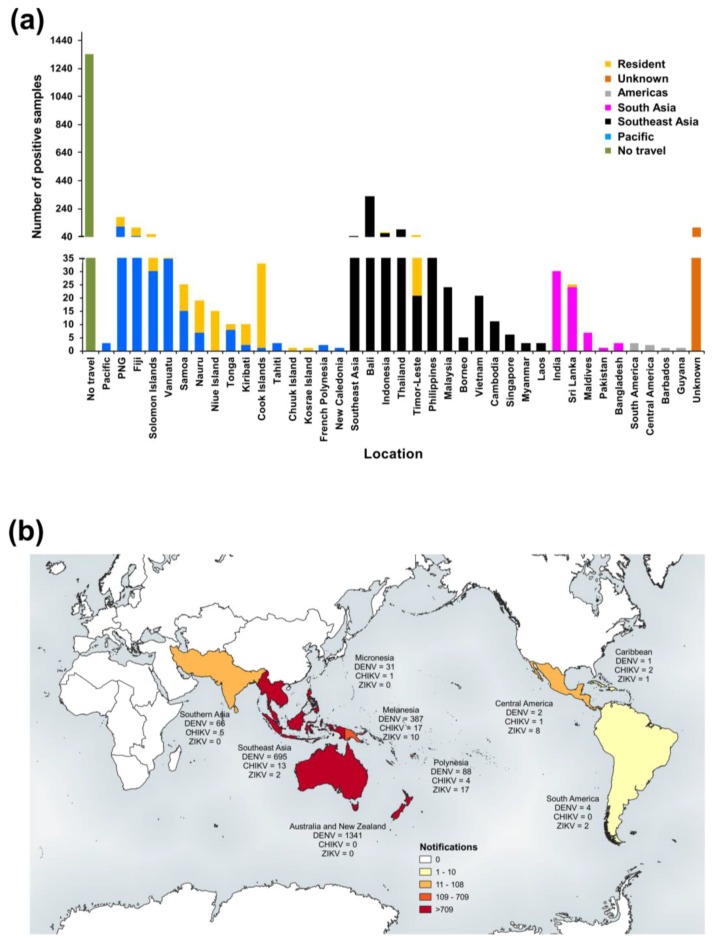
Figure 4.
RT-rtPCR/RT-PCR-positive samples reported by PHV, Queensland between 2005 and 2017 by location (region travelled from or residence). Subregional classifications were taken from the United Nations Statistics Division at https://unstats.un.org/unsd/methodology/m49/. (a) Number of DENV RT-rtPCR/RT-PCR-positive samples. Allocations to specific locations or broader subregional classifications (which exclude specific location data) were dependent on the travel information available. Patients with no travel (no overseas travel outside Australia) and patients who did not travel to Australia (resident of that location) are shown separately, including cases from the Pacific Islands, Niue, Chuuk, and Kosrae. Corresponding summaries of CHIKV and ZIKV RT-rtPCR-positive samples based on location are shown in Supplementary Figure S2B,D, respectively); (b) Choropleth map of positive DENV, CHIKV, and ZIKV RT-rtPCR/RT-PCR samples (https://doi.org/10.6084/m9.figshare.6220481.v2) based on subregional classifications. Where a sample was positive for more than one virus (e.g., DENV-1 and DENV-2), the sample was only included in the map once (n = 2). Three additional positive samples (two from the Pacific and one from the South Pacific) could not be allocated to the map subregions and were not included. Map was created using QGIS software version 3.0.1.

