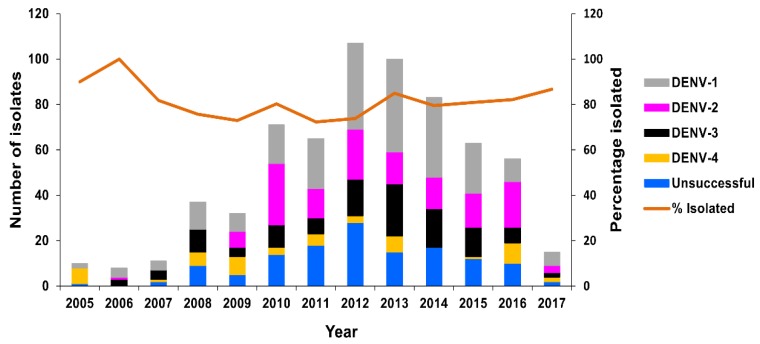
Figure 6.
Number of DENV isolates obtained, PHV, 2005–2017. The number of RT-rtPCR/RT-PCR-positive samples from which DENV isolates were obtained (grey, pink, black, and yellow bars) or not obtained (blue bar) is highlighted per year. The average percentage of successfully-isolated viruses per year is shown as a line.

