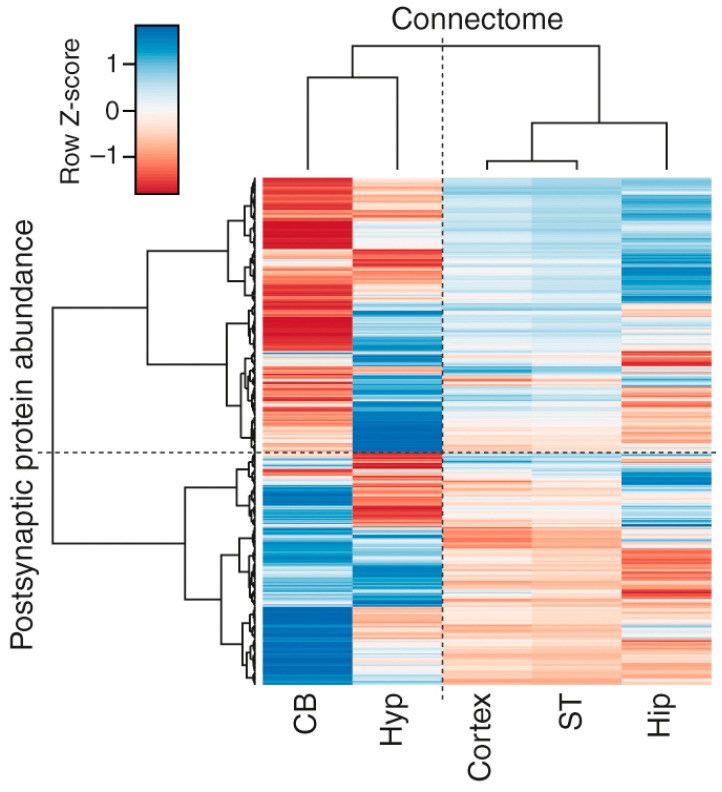
Figure 4.
Correlation between brain region-specific postsynaptic protein abundance and mesoscale connectome. Clustering heatmap of the correlation between protein abundance and neuron projection volume in each brain region. Color key shows Z-transformed correlation values; red corresponds to negative correlation and blue to positive correlation.

