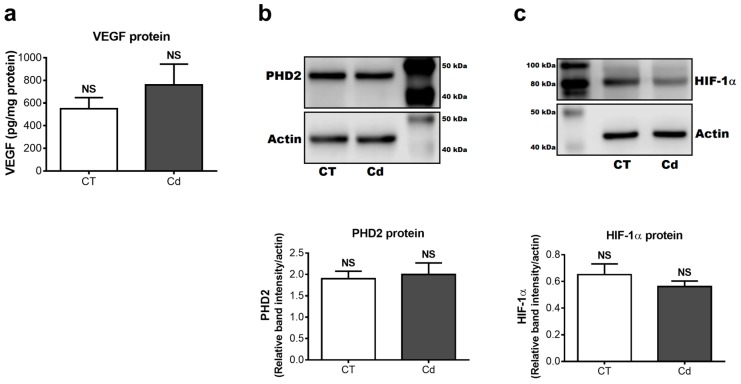
Figure 3.
Protein levels of (a) VEGF (p = 0.3389, Student’s t-test), (b) PHD2 (p = 0.7702, Student’s t-test), and (c) HIF-1α (p = 0.3476, Student’s t-test) in renal tissue from control and Cd-exposed fetuses. (b,c) show representative blots of one of six samples from each group, and densitometry. Band intensities were normalized to actin level. VEGF concentration was normalized to protein content. Each sample was run in duplicate. Means ± SEM are shown, n = 6. NS, not statistically significant.

