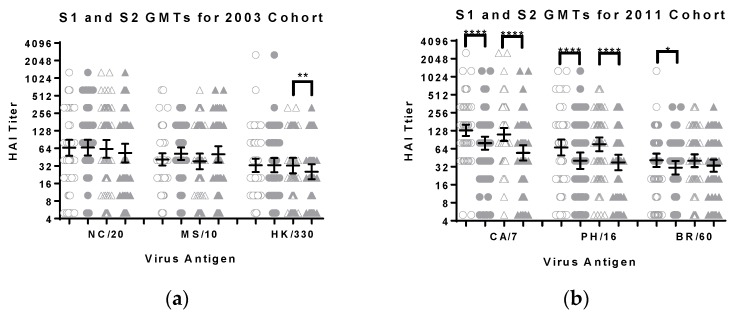
Figure 1.
The geometric mean titers, with 95% confidence intervals, for sera samples from the (a) 2003 and (b) 2011 cohorts are shown. The individual S1 and S2 data points are shown as open and filled symbols respectively, circles for men and triangles for women. The antigens tested with the 2003 cohort were A/New Caledonia/20/1999 (H1N1), A/Moscow/10/1999 (H3N2) and B/Hong Kong/330/2001 (Victoria lineage). The antigens tested with the 2011 cohort were A/California/07/2009 (pdmH1N1), A/Perth/16/2009 (H3N2) and B/Brisbane/60/2008 (Victoria lineage). The difference between male and female titers (S1 or S2) did not reach the level of significance (Mann Whitney test). The difference between the S1 and S2 titers for each group was evaluated using the Wilcoxon matched-pairs rank test and the p-values are shown: *, p ≤ 0.05; **, p ≤ 0.01; and ****, p ≤ 0.0001.

