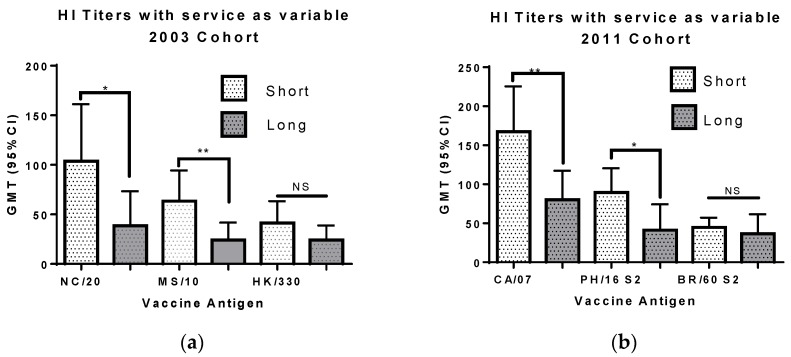
Figure 3.
The geometric mean titers (with 95% confidence interval) for sera from personnel with short and long service are shown. The data for (a), the 2003 cohort, are from 48 subjects with 1–2 years of service and 19 subjects with 8–9 years of service. The data for (b), the 2011 cohort, are from 63 subjects with 1–2 years of service and 23 subjects with 8–9 years of service. The viruses used for testing HI titer are listed on the x axis: NC/20, A/New Caledonia/20/1999 (H1N1); MS/10, A/Moscow/10/1999 (H3N2); HK/330, B/Hong Kong/330/2001 (Victoria lineage); CA/7, A/California/07/2009 (pdmH1N1); PH/16, A/Perth/16/2009 (H3N2); and BR/60, B/Brisbane/60/2008 (Victoria lineage). The difference between the short and long service groups was evaluated using the Mann Whitney rank test. NS, not significant; *, p < 0.05; and **, p < 0.01.

