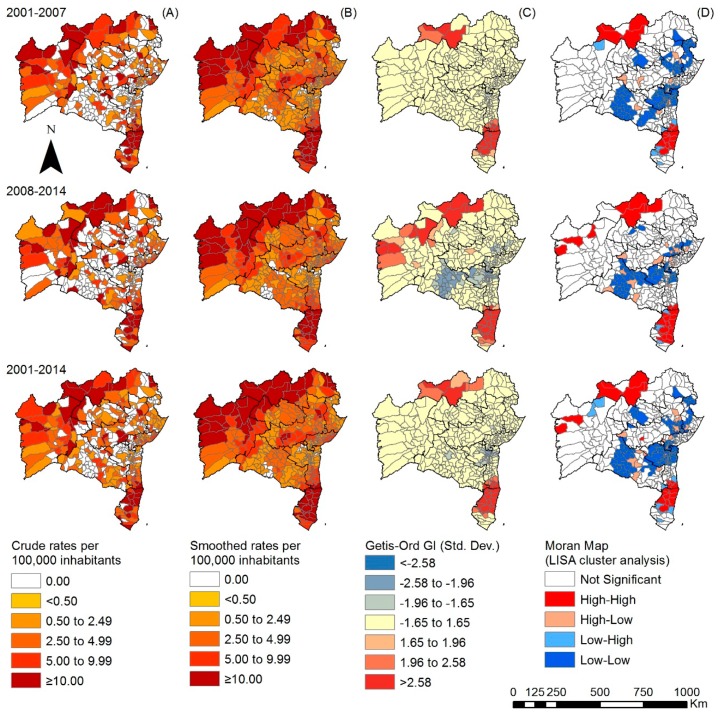
Figure 3.
Spatiotemporal distribution of the overall new case detection rate of leprosy in <15 year-olds by municipality, Bahia state, 2001–2014: (A) crude detection rates of new cases of leprosy (per 100,000 inhabitants); (B) Bayesian-smoothed detection rate (per 100,000 inhabitants); (C) hot-spot analysis (Getis-Ord Gi*) and (D) LISA cluster analysis (Moran Map).

