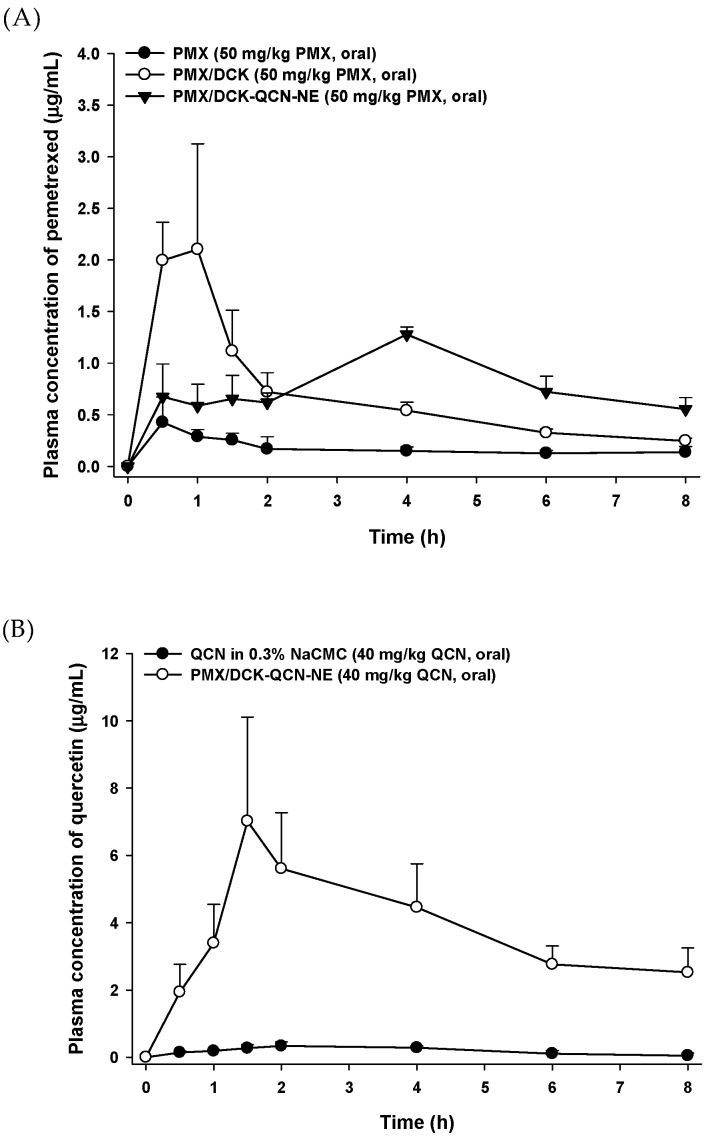
Figure 5.
The mean plasma concentration-time profiles of PMX and QCN after single oral administration of (A) PMX (50 mg/kg), PMX/DCK (equivalent to 50 mg/kg PMX), or PMX/DCK PMX/DCK-QCN-NE (equivalent to 50 mg/kg PMX) and (B) QCN in 0.3% NaCMC (40 mg/kg) or PMX/DCK-QCN-NE (equivalent to 50 mg/kg PMX) to rats. Values are expressed as mean ± standard deviation (n = 4).

