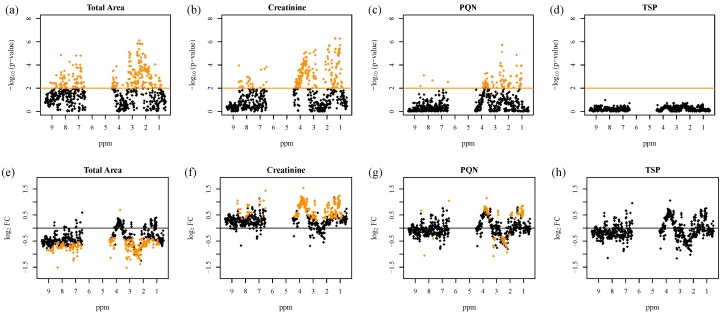
Figure 2.
Test for differentially regulated metabolites in 1D 1H urinary nuclear magnetic resonance (NMR) fingerprints between acute kidney injury (AKI) and healthy patients with respect to different normalization strategies. –Log10(p-values) of moderated t-test analysis are shown after preprocessing with four different normalization methods: scaling to (a) equal total spectral area, (b) scaling to creatinine, (c) probabilistic quotient normalization (PQN), and (d) scaling to the internal reference TSP, plotted versus the ppm regions of the corresponding NMR buckets (upper panels). The significance level for Benjamini–Hochberg (B/H) adjusted p-values below 0.01, corresponding to a false discovery rate (FDR) below 1%, is marked by an orange line, and the significant NMR features are indicated as orange diamonds. The corresponding log2 fold changes (log2 FC) plotted versus the ppm regions are shown in the lower panels (e–h). Since log2 FCs were calculated as AKI minus non-AKI, positive log2 FCs correspond to higher values in AKI than in non-AKI samples. Figure adapted from Zacharias et al. (2017) [22].

