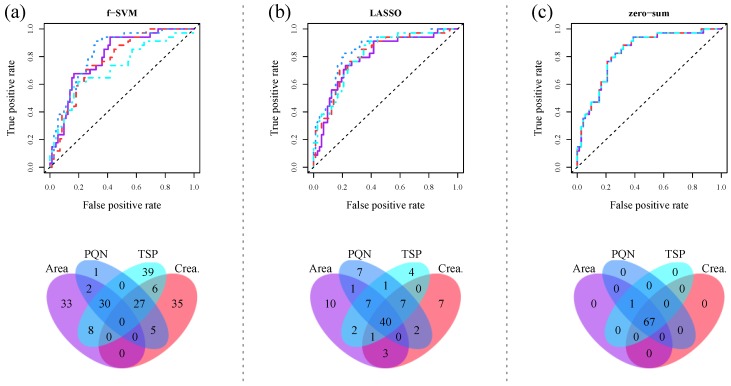
Figure 3.
Receiver operating characteristic (ROC) curves as well as Venn diagrams of selected classification features for the discrimination of AKI from non-AKI patients based on urinary 1D 1H NMR fingerprints. Four different normalization strategies were employed: scaling to total spectral area (violet solid line), scaling to creatinine (red dashed line), probabilistic quotient normalization (PQN) (blue dotted line), and scaling to the internal reference TSP (cyan dashed–dotted line). Common classification approaches such as (a) support vector machine (SVM) in combination with t-test based feature filtering, and (b) least-absolute shrinkage and selection operator (LASSO) regression show a clear dependence on the chosen normalization strategy, whereas (c) zero-sum regression is completely independent thereof. Figure adapted from Zacharias et al. (2017) [22].

