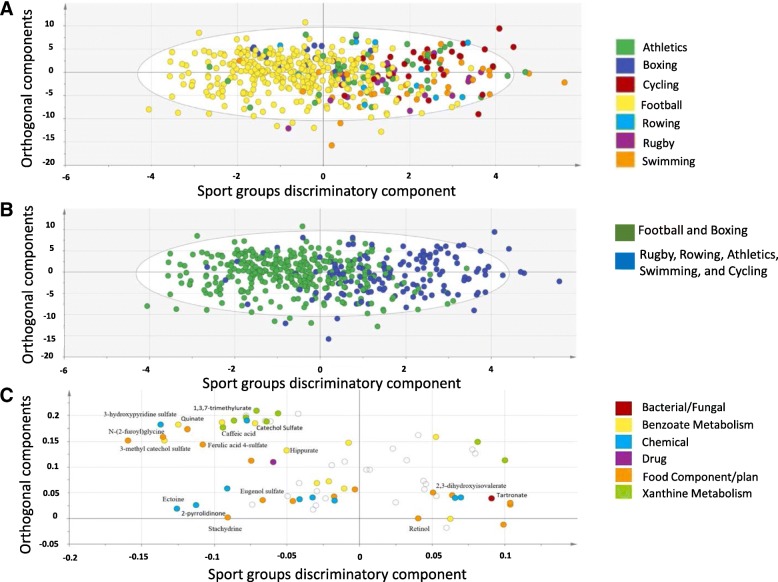
Fig. 1.
OPLS-DA model comparing elite athletes belonging to different groups of sports (athletics, boxing, cycling, football, rowing, rugby and swimming). a A score plot showing the class-discriminatory component (x-axis) versus orthogonal component (y-axis) among all sport groups. b A score plot from an updated OPLS-DA model featuring combined groups (group 1: football and boxing, group 2: rugby, rowing, athletics, swimming and cycling). c The corresponding loading plot from the updated model showing clusters of xenobiotics at opposite sides of group one or group either ends of the discriminatory component along the x-axis

