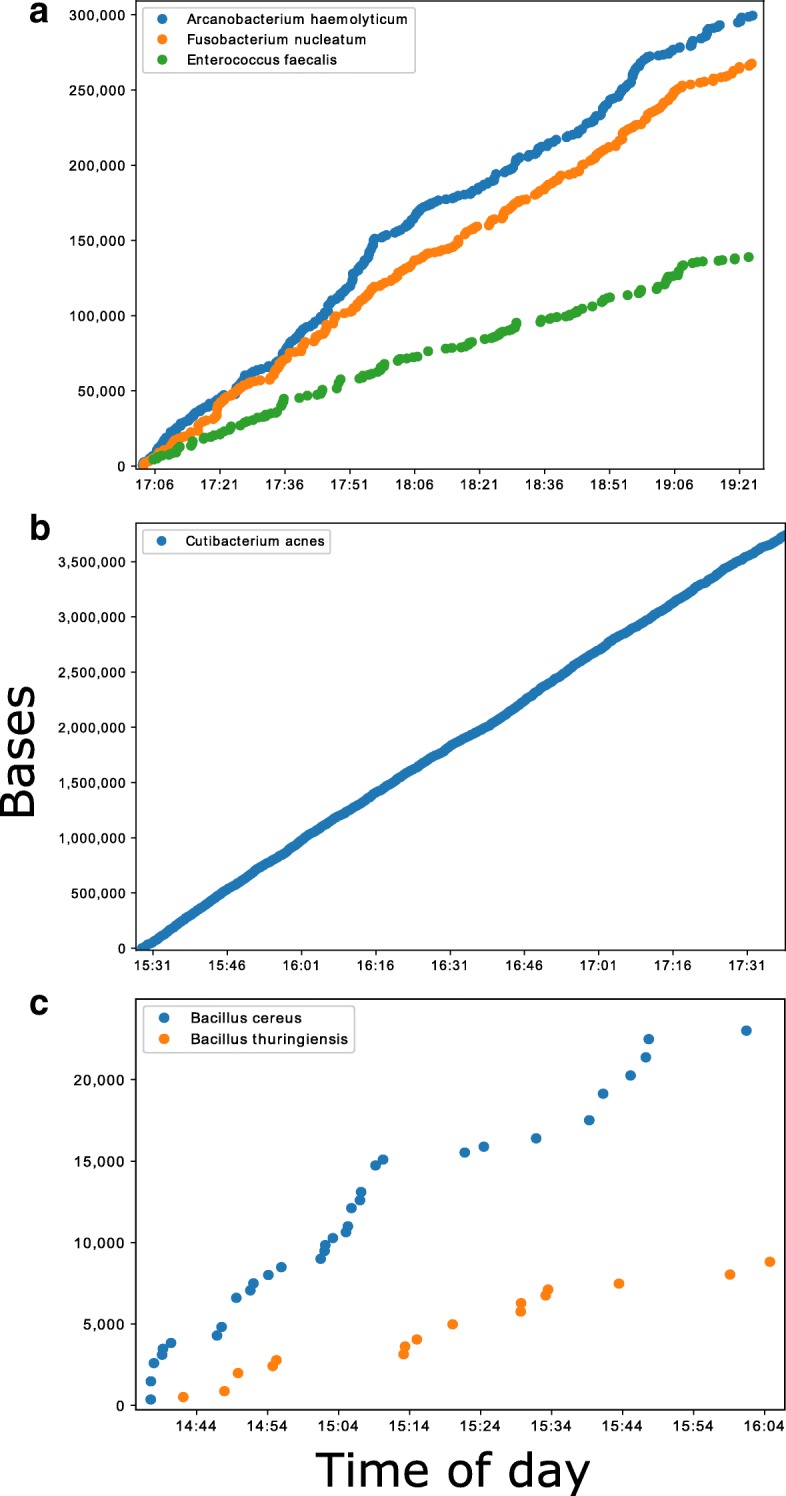
Fig. 2.

Cumulative bases classified by Centrifuge and minimap2 reference alignment over the first few hours of sequencing on the MinION. Each marker on the plots represents a new sequence classified. Times are on the day of sequencing and taken from the read timestamp and doesn’t include bioinformatic time. Three samples shown showcasing the best and worst performers. a Sample 354a containing three different species. b Sample 249a containing Cutibacterium acne. c Sample 352a containing two different Bacillus species
