Figure 3.
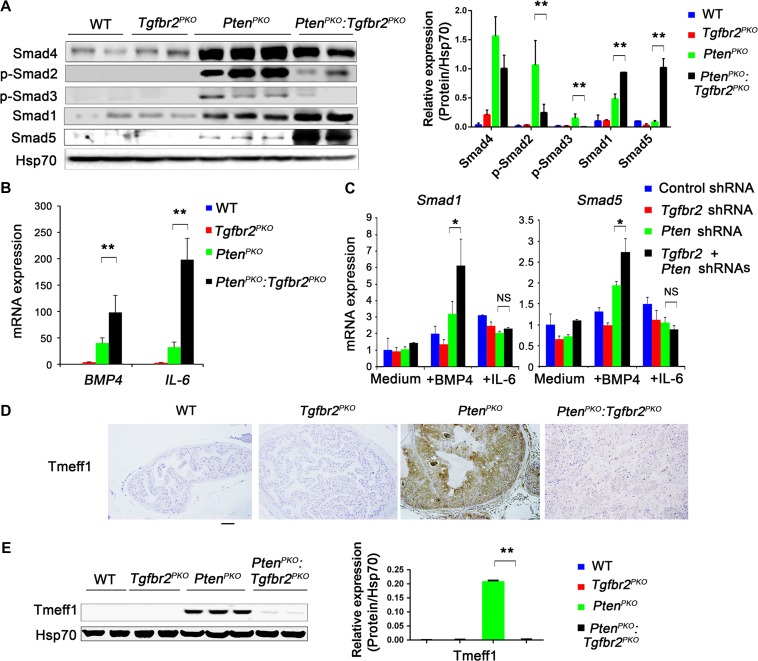
BMP/SMAD/ID1/STAT signaling upon ablation of Pten and Tgfbr2. (A) WB analysis of Smad4, pSmad2, pSmad3, Smad1, and Smad5 expression in prostates from the indicated mice. (B) Expression levels of BMP4 and IL-6 were analyzed by qRT-PCR in prostate tissues from the indicated mice. (C) TRAMP-C3 cells were transduced with the indicated shRNAs for 48 h, and subsequently treated with 50 ng/ml BMP4 or 100 ng/ml IL-6 for an additional 24 h. Expression of Smad1 or Smad5 was analyzed by qRT-PCR. (D) Immunohistochemical analysis of Tmeff1 expression in prostate tissues of mice with the indicated genotypes. Scale bar, 100 μm. (E) WB analysis of Tmeff1 expression in prostate tissues from mice with the indicated genotypes. In A, B, C, and E, data are plotted as mean ± SD and are representative of three independent experiments. *P < 0.05, **P < 0.01 vs. corresponding control.

