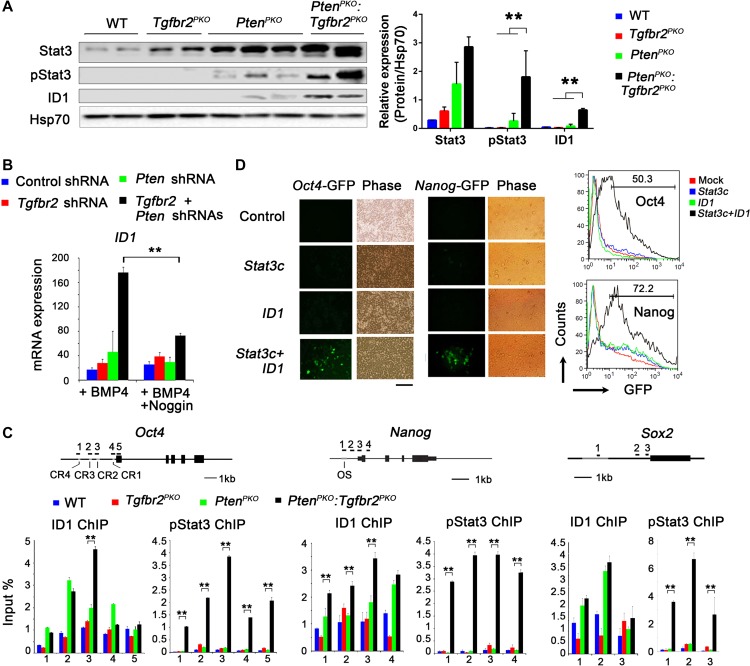
Figure 5.
Increased pluripotency and ID1 and pStat3 binding to pluripotency gene promoters upon ablation of Pten and Tgfr2. (A) WB analysis of Stat3, pStat3, and ID1 expression in prostates from mice with the indicated genotypes. (B) TRAMP-C3 cells were transduced with the indicated shRNA for 48 h, and subsequently treated with 50 ng/ml BMP4 or a combination of 50 ng/ml BMP4 and 10 ng/ml Noggin for an additional 24 h. Expression of ID1 was analyzed by qRT-PCR. (C) ChIP–qPCR analysis to determine ID1 and pStat3 binding to the promoter regions of Oct4, Nanog, and Sox2 in prostate tissue from mice with the indicated genotypes. Numbered black bars indicate primer locations (top panel). Values are reported as fold enrichment relative to input DNA. (D) Human 293T cells harboring Oct4 or Nanog promoter-fused-GFP plasmids were transfected with activated Stat3 (Stat3c) or ID1. Fluorescence images (left) and fluorescence-activated cell sorting (FACS) results of GFP expression in 293T cells at 2 days after transfection. Scale bar, 50 μm. In A, B, and C, data are plotted as mean ± SD and are representative of three independent experiments. *P < 0.05, **P < 0.01 vs. corresponding control.

