Figure 6.
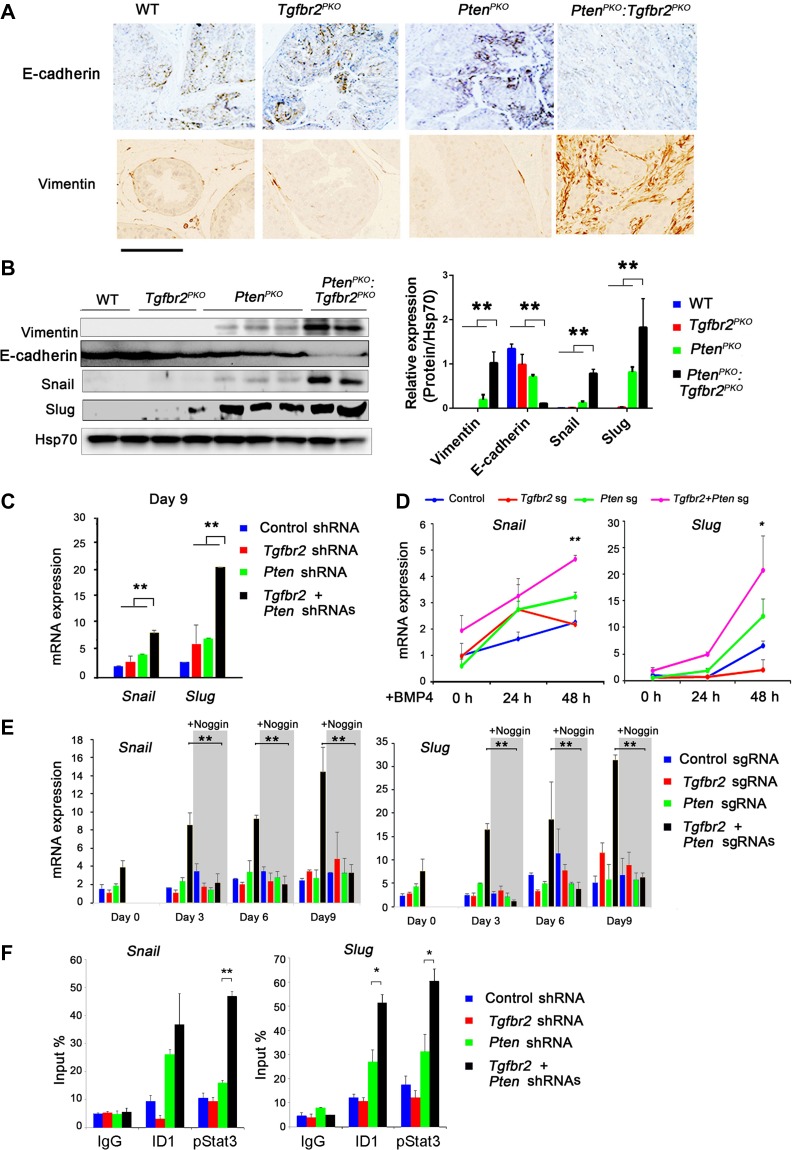
EMT-related gene expression upon ablation of Pten and Tgfbr2. (A) Immunohistochemical staining of E-cadherin and Vimentin in prostate tissues from mice with the indicated genotypes. Scale bar, 100 μm. (B) WB analysis of Vimentin, Snail, Slug, and Hsp70 (loading control) levels in prostate tissues from mice with the indicated genotypes. (C) TRAMP-C3 cells were transduced with the indicated shRNAs, and subsequently OSKM-reprogrammed for 9 days. Expression of Snail and Slug was analyzed by qRT-PCR. (D) The indicated KO TRAMP-C3 cells were generated using the CRISPR/Cas9 shRNA. Next, the cells were treated with 50 ng/ml BMP4 for 48 h. Expression of Slug and Snail was analyzed by qRT-PCR. (E) The indicated KO TRAMP-C3 cells were OSKM-reprogrammed for 9 days with or without 10 ng/ml Noggin treatment. The RNA was collected at different time points. Expression of Snail and Slug was analyzed by qRT-PCR. (F) Determination of ID1 and pStat3 binding to the promoter regions of Snail and Slug in TRAMP-C3 cells transduced with the indicated shRNAs by ChIP−qPCR analysis. Values are reported as fold enrichment relative to input DNA. In B, C, D, E, and F, data are plotted as mean ± SD and are representative of three independent experiments. *P < 0.05, **P < 0.01 vs. corresponding control.

