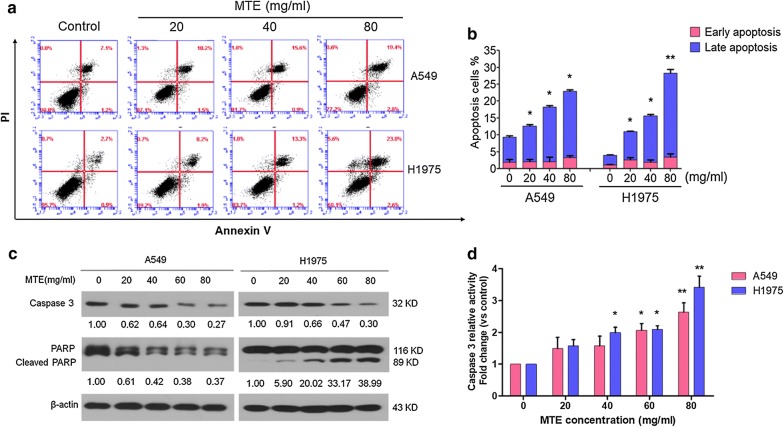
Fig. 2.
MTE treatment induced apoptosis in NSCLC cells. A549 and H1975 cells were treated with 0, 20, 40, 60 and 80 mg/ml MTE for 24 h. a Apoptotic cells were counted by Annexin V/PI assay. In the four fields of the original images, the dots indicated the number of Annexin V−/PI− (bottom-left field indicates live cells), Annexin V+/PI− (bottom-right field indicates early apoptotic cells), Annexin V+/PI+ (top-right field indicates late apoptotic cells), and Annexin V−/PI+ cells (top-left field indicates dead cells), respectively. b The percentage of early and late apoptotic cells were quantified, respectively. Early-stage apoptotic cells in the figures were shown in red, and late-stage apoptotic cells were shown in blue. c The protein levels of Caspase 3 and PARP were determined by Western blot, and the expression ratio was counted. β-Actin was used as loading control. Data are one representative experiment performed in triplicate. d The Caspase 3 activities in MTE treated cells were detected. A549 cells were shown in red, and H1975 cells were shown in blue. *P < 0.05, **P < 0.01 vs control group

