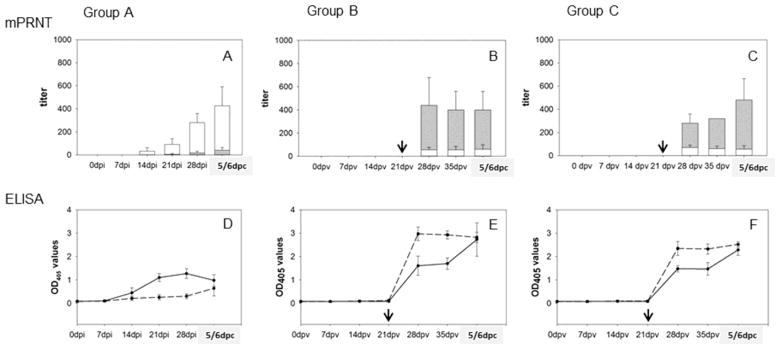
Figure 2. Neutralizing and anti-glycoprotein antibodies.
Titers of neutralizing antibodies as determined by mPRNT are plotted by group. Group A represents titers of neutralizing antibodies in serum of pigs infected and at 28dpi challenged with NiV (Fig. 2.A). Group B are pigs vaccinated with sGHEV and at 35dpv challenged with HeV (Fig. 2.B). Group C are pigs vaccinated with sGHEV and challenged with NiV (Fig. 2.C). White columns represent the mean (and standard deviation) of antibodies neutralizing NiV, and gray overlapping columns represent the mean (and standard deviation) of antibodies neutralizing HeV. Black arrows indicate boost for vaccinated animals (group B and C). Anti-G antibody development measured by ELISA is plotted in values of optical density at 405nm in Fig. 2.D for group A, Fig. 2.E. for group B, and Fig. 2.F for group C. Solid black line represents anti-NiV G (GNIV) antibody OD405 readings, and dashed line represents anti-HeV G (GHEV) antibodies.

