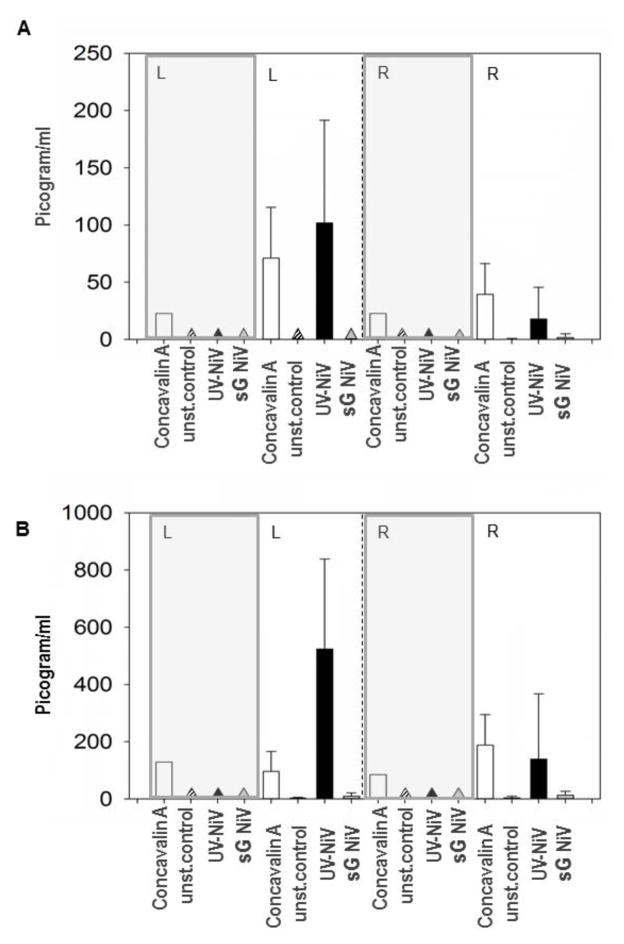
Figure 5. Detection of IL-10 and IFN-gamma.
Production of IL-10 and IFN-gamma in restimulated PBMC was detected only in cells from pigs in Group A. Gray panels designate results from challenge control pigs. Triangles indicate lack of cytokine detection. Fig. 5.A Detection of IL-10 in picogram/ml in supernatants from restimulated PBMC: left section (L) prior to the challenge, right section (R) post challenge. White bars are cells restimulated with concavalin A, unstimulated cell controls (unst.control) are designated as stripe bars/triangles. Cells restimulated with UV inactivated NiV (UV-NiV) are indicated by black bars/triangles, and cells restimulated with sGNiV are designated as gray bars/triangles. Fig. 5.B illustrates production of IFN gamma by restimulated PBMC from group A pigs; designations are as in Fig. 5.A.

