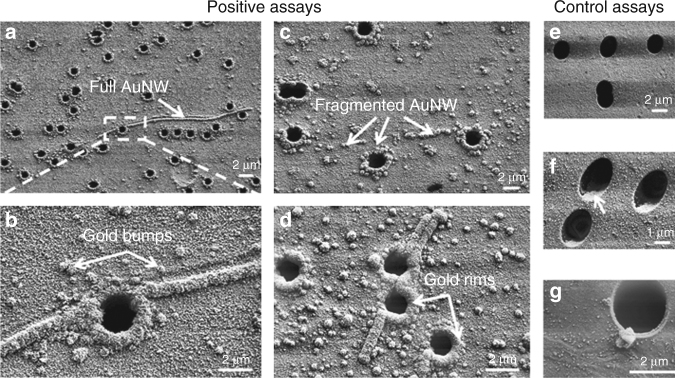
Fig. 2.
SEM images of membrane top surfaces after assays: a–c after a positive assay with 1 nM PLP; d after a positive assay with 50 fM PLP; e after a control assay with zero PLP concentration in which AuNPs incubation was omitted; f after a control assay with zero PLP concentration; and g after a control assay with 1 nM PLP concentration in which DNA stretching was omitted. In a–c, full AuNWs are visible; in a–d, gold rims and gold bumps are visible; in c, a fragmented AuNW is visible; in b–d, f–g, AuNPs are visible; in f, the arrow indicates a gold evaporation shadow. AuNPs, gold nanoparticles; AuNWs, gold Nanowires; PLP, padlock probes; SEM, scanning electron microscopy

